I own a lot of robots! And most of them are under the control of Arduino boards.
While the development on the Arduino platform is exciting, it does come with its set of challenges. The Arduino 1.x IDE isn't exceptional, the 2.x feels somewhat like a budget version of VSCode. In both versions, one of their many issues lies in the absence of a proper debugger. Throughout the programming of a project, especially as it becomes more intricate, errors can crop up at any moment. Effectively identifying these errors is a crucial skill for any Arduino developer. The conventional and simplest method involves sending textual information over the serial port and using the monitor as a debugging screen. However, monitoring the execution of a loop or complex code quickly becomes challenging as it is not possible to pause the program at the right moment to study its internal state.
Serial.println("so far, so good!");Here's another approach I suggest in this article: step-by-step debugging..
The method I'm going to show you is compatible with many programmable boards. I personally use it with all types of Arduino boards (nano, uno, mega, etc.), but with a bit of adaptation, it would also work with ESP boards or others. We will, as much as possible, use free tools (or for a few euros at the end of the article) so that the method is suitable for hobbyists.
Installation of the programming environment
Regardless of your programming software, whether it's Arduino IDE, CLion, VSCode, etc., it inevitably comes with debugging tools. These tools can vary in capabilities, complexity of usage, or hardware requirements.
The method I'm suggesting uses the free PlatformIO IDE. The tool is free and open-source. It's cross-platform (Windows, Linux, Mac, etc.), supports multiple architectures (x32, x64, ARM, etc.), works with multiple frameworks (Arduino, ESP, Simba, etc.), and is built on the foundation of VSCode. In short, it's the perfect IDE for embedded system programming in C/C++... or if close to perfect.
Its installation is straightforward: go to the link https://platformio.org/platformio-ide and follow the instructions.
Take a few minutes to install the IDE, and I'll meet you as soon as it's done! ☕︎
Project setup
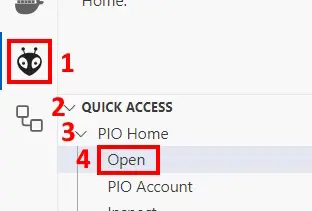
Once installed, a nice little alien icon appears in the toolbar on the left side of VSCode. It's by clicking on this icon that we will begin. Note that the PlatformIO homepage can be found in Quick Access > PIO Home > Open. It's not very intuitive, and it's true that PlatformIO (just like VSCode on which it is based) suffers - in my opinion - from this lack of interface clarity: it's not always easy to navigate or explore its otherwise extensive documentation.
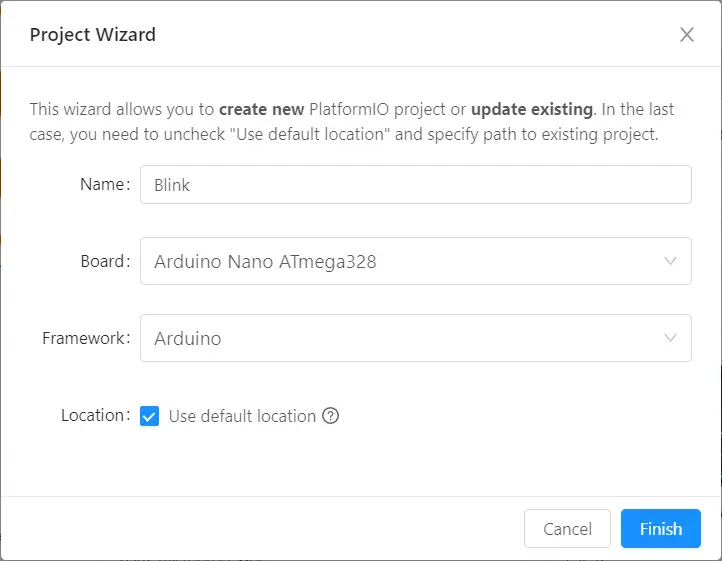
A set of options is now presented to us: opening an existing Arduino project or creating a new project. For the following steps, I will create a new project, but the process is the same for an existing Arduino code: just specify the location of your code and the board (Arduino Nano, Uno, etc.) for your project.
For this article, I will create a new project named Blink to run on an Arduino Nano board: Arduino Nano ATmega328.
The file that opens on the screen is named platformio.ini. In this file, we will make most of our modifications later on, but for now, let's focus on the rest of the project structure created. PlatformIO creates a file structure for managing complex projects, with different folders (include, lib, src, test, ...). In the src folder, we find the first file generated by the software, named main.cpp. Although it doesn't have the .ino extension you are probably accustomed to, the code behaves in the same way. Let's modify the file to contain the following code:
#include <Arduino.h>

uint8_t counter = 0;

void setup() {
  pinMode(LED_BUILTIN, OUTPUT);
}

void blink() {
  digitalWrite(LED_BUILTIN, HIGH);
  delay(100);
  digitalWrite(LED_BUILTIN, LOW);
  delay(100);
}

void loop() {
  if (counter < 300) {
    blink();
  }
  counter++;
}
This code isn't very clever: it blinks a LED 300 times.
Our code declares a global variable of type unsigned 8-bit integer. In the main loop, this variable, called counter, is successively incremented, so it takes on values like 1, 2, 3, etc. As long as this counter remains below 300, a function named blink makes the LED on the Arduino board blink. When the counter exceeds 300, the blinking stops. This is the theoretical behavior of the code, but apparently, some issues persist.
#include <Arduino.h>.This line is usually automatically added at compile time by the IDE dedicated to the Arduino framework, such as the Arduino IDE. Since here the PlatformIO software allows coding for different types of frameworks, it is necessary for us to explicitly add this inclusion.
Connect your Arduino Nano to one of the USB ports of your computer, as you typically would for programming. Now, click on the main menu Run > Run without debugging or use the keyboard shortcut Ctrl+F5. This action will - as the name suggests - initiate the following sequence:
- Compile the program
- Upload it to the board
- Execute the program - i.e., the continuous blinking of the built-in red LED on pin 13 of the board
Attempt at old-fashioned debugging
The usual "old-fashioned" method that most people use to debug the previous code involves using the serial port and the serial monitor to transfer and display debug information. Here in particular, we would like to know the value of the counter variable. That old-school method involves initializing the serial port in the setup() method and then sending the value of counter in the loop() method, as shown in the code below:
click to see the code
#include <Arduino.h>

uint8_t counter = 0;

void setup() {
  Serial.begin(9600);
  pinMode(LED_BUILTIN, OUTPUT);
}

void blink() {
  digitalWrite(LED_BUILTIN, HIGH);
  delay(100);
  digitalWrite(LED_BUILTIN, LOW);
  delay(100);
}

void loop() {
  if (counter < 300) {
    blink();
  }
  counter++;
  Serial.println(counter);
}
Have a try by deploying the code using the previous method (Ctrl+F5), and then opening the serial monitor:
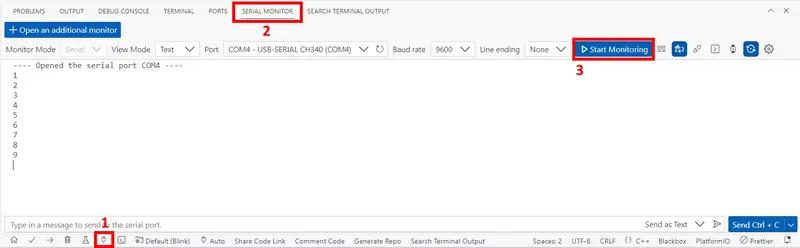
- Click on the
PlatformIO icon: Serial monitorin the shape of a power plug, in the icon bar at the bottom of the screen. - Click on the
Serial Monitortab in the window that opens. - Finally, click on the
Start monitoringbutton.
The method suffers from a few drawbacks:
- The issue with our code appears after several minutes, but how can one be certain of the exact moment?
- Assuming you got distracted, you have to restart the program and wait.
- In the case of a slightly more complex program, the serial monitor scrolls at a speed that doesn't allow for a detailed analysis - or even reading.
- It can be challenging to display the content of more complex variables (a vector, a buffer, a large array of values, etc.).
- Any variable whose value is not dumped into the serial port is not displayed, and if you forgot an important one, you have to start over.
- The serial port is monopolized during debug display and cannot be used in parallel in our program.
Setting up step-by-step debugging
I know I talk (or write) a lot, but finally, here we are: let's explore a more suitable method.
The first thing to do is to configure our software for debugging:
- Open the platformio.ini file located at the project's root.
- Modify the file so that its content is as follows:
[env:default]
platform = atmelavr
framework = arduino

; Compatible boards with the debugger:
;  https://docs.platformio.org/en/stable/plus/debug-tools/avr-stub.html#boards
board = nanoatmega328
; board = uno
; board = megaatmega2560

; Configure debugger tool
debug_tool = avr-stub
debug_port = COM3

; GDB stub implementation
lib_deps =
  jdolinay/avr-debugger
This file configures the behavior of PlatformIO for our project.
- The first line indicates the start of a section. Here, we configure the default environment, meaning that our project behaves the same under all conditions. However, it is possible to configure different behavior or settings based on whether we want to debug or compile for release, as well as the specific board we want to work with. It is possible to make these configurations more complex, for example, to test our code simultaneously on two different boards connected to different ports of the computer.
More information: https://docs.platformio.org/en/latest/projectconf/sections/env/index.html - The next two lines define the platform and framework, i.e., the compilation toolchain used. In simple terms, compilation transforms our C++ code into code specific to the target microcontroller. Here, that is Arduino boards with AVR family processors.
- Next, we define the board that will be used. Again, because each board has a different processor and hardware specifications, we need to be precise. Our compiler supports a large number of boards, but the debugger supports a bit less. (see point 4)
- Now is the time to configure the debugger. Here, we will use avr-stub, which is specific to AVR family processors. This debugger supports a limited number of architectures, frameworks, and boards (actually, all Arduino-type boards).
More information: https://docs.platformio.org/en/stable/plus/debug-tools/avr-stub.html - Then, we specify the debug port. Note that this line is optional if only one Arduino board is connected to the computer: PlatformIO will detect it automatically.
- Finally, we include a dependency on the jdolinay/avr-debugger library. Here, you see the magic of PlatformIO, which will automatically find, download, compile, and link this library to the project! This library contains the Arduino code allowing our board to communicate with the debugger via the serial port.
Once done, we need to make a few changes to our code. We will start from our initial version without the Serial debug. It will be necessary to add:
- Two
#includestatements at the beginning of the file (but after the<arduino.h>one) to use the debug library in our code. - A call to the
debug_init()method at the beginning of the setup() function.
Here is the resulting code:
#include <Arduino.h>
#include "avr8-stub.h"
#include "app_api.h"

uint8_t counter = 0;

void setup() {
  debug_init();
  pinMode(LED_BUILTIN, OUTPUT);
}

void blink() {
  digitalWrite(LED_BUILTIN, HIGH);
  delay(100);
  digitalWrite(LED_BUILTIN, LOW);
  delay(100);
}

void loop() {
  if (counter < 300) {
    blink();
  }
  counter++;
}
Create breakpoints and start debugging
Everything is ready for the big moment: the one that usually blows our minds the first time we discover step-by-step debugging 🤯.
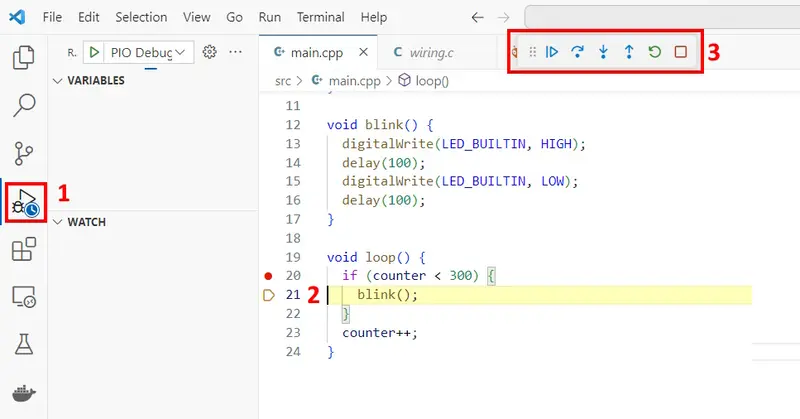
In PlatformIO, hover your mouse over the line number 20. You'll notice a red dot appearing on the left. Click it, and this red dot will now be activated.
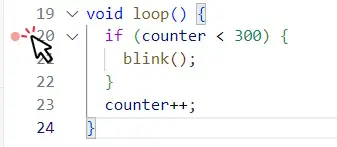
This red dot is called a "breakpoint." When running the program in debug mode, it will execute it until reaching this line. The debugger will then pause the program, allowing exploration of its internal values. Let's see that in practice.
Restart the program, this time in step-by-step mode. To do this, press F5 or use the Run > Start Debugging from the top menu.
- Launching and running a program in debug mode is slower than the classic mode. So, you'll need to be patient for a few seconds: this is indicated by an hourglass on the corresponding tool on the left bar.
- Once launched, the program will execute until the breakpoint. Here, we see it paused before the execution of line 21. It means that the condition on line 20 has evaluated to true and the program waits to execute line 21.
- A control toolbar for step-by-step debugging has appeared.
From left to right, the offered tools are:
- Continue (F5): Continue program execution.
The execution will continue until the next encountered breakpoint. Here, it will blink the led using the blink() method, increment the counter (line 23), go through the loop again, re-evaluate the condition on line 20 and finally stop again at line 21. - Step Over (F10): Continue to the next line - without going into function details.
From the current breakpoint, pressing F10 will execute line 21 and move to the next "semantic" line: the number 23. The program will execute the entire blink() function - making the LED blink - and pause again at line 23, waiting for the increment. - Step into (F11): Continue to the next effective line.
Let's get back to the current breakpoint at line 20: the program is paused, waiting to execute the blink function. In contrast to the previous option, pressing F11 here will enter the blink() function and pause at the next line to execute. So, the program will wait at line 13 and this line will not be executed yet. The LED is therefore still off. - Step out (F12): Continue until exiting the current function.
After the previous action, we are now inside the blink() function at line 13. If we choose F10, we will turn on the LED and wait at line 14. If we choose F11, we will enter the digitalWrite() function and delve into the Arduino code. In contrast, the Step Out option or F12 will execute all lines of the current method (blink) and wait at the exit. In our case, we will reach line 23, as the LED blinking has been done. - Restart (Ctrl+Shift+F5): Restart from the beginning.
As the name suggests, the program will restart from the beginning, and the debugger will pause at the first encountered breakpoint. - Stop (Shift+F5): Stop program execution.
As the name suggests, it terminates the program's execution and exits debug mode.
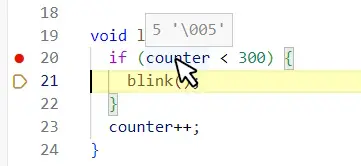
Let's launch our program in debug mode and press F5 a few times: continue. This way, we will make the LED blink several times, and each time, we will find ourselves paused at line 20.
By hovering over different elements of the program, we can see their values in realtime. In particular, on the variable counter I see the value 5 here, indicating that I've gone through my loop 5 times. I also observe that the incrementation is done correctly and the value of my counter is increasing.
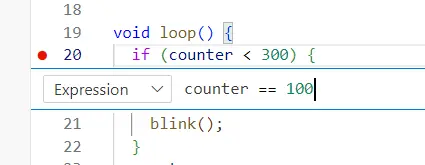
You might have guessed it, progressing this way can be laborious. Therefore, PlatformIO offers a so-called conditional breakpoint.
Right-click on the red dot at line 20 and choose the Edit Breakpoint... option.
Let's add the condition counter == 100.
By restarting the execution with the Continue command (F5), the program will resume and the LED will blink multiple times until our program pauses again. At this point, hover your mouse over the counter: we have progressed to the 100th execution.
This guide is not a course on Arduino programming, so let me show you how to debug the error until we find the resolution: I will not expand much on the reason being the error. We will apply here a method called "dichotomous thinking" by spliting the problem in halves until we find the issue. The problem seems to occur during the comparison of counter with the value 300. If we had not already guessed the problem, here is what I would do:
- Set a conditional breakpoint up to the value 299 to see what happens during the 300th loop. It turns out that our program never stops: that proves that we never reach this value. By manually pausing (
F6) the execution and inspecting the counter value, I get an improbable value. - We already know from our previous test that the execution worked up to the value 100. So let's try something between 100 and 300. Let's try to set the conditional breakpoint on the value 200.
- It works: the program stops here. The problem is therefore between the loops 200 and 299. Let's adjust the breakpoint condition to 250.
- Still good! Let's continue by narrowing the interval. 275 no longer works. 260? Neither... 254 is good. Continuing this way, I reach a last functional breakpoint at 255.
- Now let's go line by line using
F10. By inspecting the value of counter at each line, I discover that here, the program calculates255 + 1 = 0. Whaaaat?
b1111_1111 (8bits). By adding 1, we go to 255+1=256, which in binary is b1_0000_0000 (9bits). However, our counter is declared as uint8_t, meaning a positive integer on 8 bits. Only the last 8 bits are kept here - the last 8 zeros - therefore b0000_0000 which is 0. We say that the counter overflows, meaning it exceeds its allocated size. To avoid crashing, the Arduino framework has decided to wrap the value, meaning keeping only the last 8 bits. Therefore, our counter never reaches 300, and that's the origin of the observed error.
Advanced Debugging: Free the serial port!
Rewind: in the section Attempt at old-fashioned debugging I listed several drawbacks related to using the serial port for debugging. I hope you are now convinced of the benefits of a "real" step-by-step debugger. However, we have not yet addressed the last point in this drawbacks list: how to use the serial connection while debugging our program simultaneously? Yes, it is indeed possible! 🤯
I am sorry to say, but to understand properly the next bit, we will have to get a few word on some technical topics.
In practice, to communicate with the outside world, Arduino boards have various communication protocols available. Perhaps these names will sound familiar to you: SPI, I2C, UART, etc...
Let's focus more specifically on the UART protocol. It is a serial communication protocol requiring two cables, called RX and TX. RX receives information, while the TX cable transmits it. By connecting the RX cable of a UART-compatible device to the TX cable of another and vice-versa, these two devices can exchange information in both directions.
To upload your program to the Arduino board, you probably connected it to the USB port of your computer. In term of hardware, your Arduino board has a built-in UART-USB converter plug to its pins 0 and 1. Those pins (0 and 1) are also used by the Serial library and are initialized for communication when you write Serial.begin(). You don't need to give them as parameters, that is built-in. Just as per the avr-debugger, at least by default here. Since it is not possible to simultaneously use this UART0 connection (pins 0 and 1) for two different and simultaneous usage, we can't use both the Serial library and avr-debugger. The trick is therefore to find another pair of pins that would allows a UART connection. Several possibilities are available to us:
- Use other pins for uploading Arduino code. This is theoretically possible but complicated. Indeed, the use of pins 0 and 1 for code upload UART transfer is deeply rooted into the Arduino bootloader. It would be need to hack it (modify it) and then flash it back to the board according to a specific procedure. This is a path that I do not recommend.
- Use another pair of pins for data transfer via Serial. This is entirely possible.
- Some boards - like the Arduino Mega - have multiple hardware UART connections. For instance pins 14 to 18 can be used under the name UART1, UART2, and UART3. These pairs are standard on the board and both the Serial library and the avr-debugger library can use them.
- It is also possible to software simulate a serial connection via the SoftwareSerial library.
- In all cases, an additional UART-USB converter will be necessary to connect this second serial connection to the computer. This can be done in two ways:
- By purchasing an external UART-USB converter. Any brand, even the cheapest ones for 1.10€ on AliExpress is suitable.
- By using a second Arduino board (any model) for which we will use its built-in converter on pins 0 and 1.
- Debugging can also be entrusted to a dedicated and specialized JTAG-type card - compatible with your Arduino board. However, those tools are expensive and specific to each type of board. That is a solution to be left to professionals and not something that hobbyists would really need I suppose.
If you are using a Mega board or a board with an additional UART port included, I recommend solution 2.a in conjunction with solution 3.a. That means to configure avr-debugger over UARTx and use an UART-USB converter.
If you are using a different board, I recommend solution 2.b in conjunction with solution 3.a. That means to configure a different port for your serial connection and keeping the usual UART0 port for debugging your code. Indeed, avr-debugger will not be able to use a software serial connection.
Finally, solution 3.b is a replacement for solution 3.a. Due to the negligible cost of a UART-USB conversion board, I recommend the investment.
Are you a professional? Stop tinkering and have your company invest in a more expensive but more suitable hardware: opt for solution 4.
Simulating a Serial Port
To free up the USB port (UART0) for the exclusive use of the debugger, it is possible to simulate the serial connection using the SoftwareSerial library. I won't go into details here because this goes beyond the scope of this article, but you can refer to the documentation for help.
Using UART1 for Serial Communication
Alternatively to the previous solution - and assuming you are using an Arduino with multiple UART - you can simply replace the classic code for your serial communication (meaning keyword Serial) with Serial1 for using UART1 (pins 18 and 19), Serial2 (pins 16 and 17), or Serial3 (pins 14 and 15). Again, this is beyond the scope of this article, and I recommend consulting the documentation for more details.
Using avr-debugger on UARTx
Let's focus now on an Arduino Mega board, which has the advantage of having multiple pins natively compatible with UART. To use the UARTx for debug (UART1, 2 or 3), we will need to modify our platformio.ini file as follows:
[env:default]
platform = atmelavr
board = megaatmega2560
framework = arduino

; Configure upload tool
upload_port = COM3

; Configure debugger tool
; TX(uart)<->RX(arduino) and RX(uart)<->TX(arduino)
; PIN depends on the UART number used
debug_tool = avr-stub
debug_port = COM4
build_flags = -DAVR8_UART_NUMBER=1

; GDB stub implementation
lib_deps =
  jdolinay/avr-debugger
The differences with the previous file are:
- Changing the board type to an Arduino Mega.
- The introduction of the
upload_portconfiguration, which defines the serial port used for code upload. - A new
build_flagsconfiguration allowing the addition of flags during compilation. Here, we use-DAVR8_UART_NUMBERwith a value of 1, allowing avr-debugger to use UART1 (pins 18 and 19) on our board. - Mind how the
debug_portis different fromupload_port.We now need to use an UART-USB converter - here from UART1 (pins 18-19) to USB COM4.
Using an UART-USB Converter
Now that our configuration is ready, we can reuse the code from the section Attempt at old-fashioned debugging above to use both the step-by-step debugger and our serial port with the monitor. We just need to figure out how to connect pins 18 and 19 (UART1 on the Arduino Mega) to the computer. For this, we need an UART-USB converter. These usually come in the form of a cable (TTL-USB) or a board (UART-USB) with a male USB port on one side and pins or Dupont cables on the other side.
Connection goes like this:
- RX of the board to TX (pin 18) of the Arduino.
- TX of the board to RX (pin 19) of the Arduino.
- GND of the board to GND of the Arduino.
- Leave the +5V of the board unconnected; in our example, the Arduino is already powered through the standard serial port.
It's a bit confusing, but when in doubt, you can try both configurations - it has no risk damage to your hardware.
Using an Arduino as a UART-USB Converter
Suppose you want to use an Arduino Nano as an UART-USB converter. In that case, you should connect the UART pins of the debugged Arduino Mega to the UART0 pins (pins 0 and 1) of the Arduino Nano. Then, connect that nano to the computer. To avoid actually boot and use the arduino nano processor - we only use the built-in UART-USB converter - you must shortcut connect the RESET pin to the GND.
To summarize:
- Connect RX of the debugged Arduino to pin 1 of the converter Arduino.
- Connect TX of the debugged Arduino to pin 0 of the converter Arduino.
- Connect RESET and GND of the converter Arduino together.
- (optional) I tend to recommand connecting the GNDs of both boards together as well.
Once these adjustments are made, the rest of the debugging process unfolds as before: use the F5 shortcut, and you're good to go!
Add new comment